
India is the 2nd populous country on the Planet. As per its continuous population growth, it won’t be a surprise if India takes over china to become the most populous country in the world in the coming years. Favorable weather conditions, availability of resources, vast area, etc. are some of the reasons behind this vast population of India.
You should also know that India has shown huge growth in the population from 1947 to 2023. In fact, the population of India doubled between 1975 and 2010. If you should the population of India from 1947 to 2023, you will come to know about various interesting details about the country. In today’s post, we are going to provide complete information on India’s Population from 1947 to 2023.
Overview of Year-wise India’s Population
As per the data of Worldometer, the data of current population of India is given below.
| Current Population of India | 1,380,004,385 |
| Percentage of total world’s population | 17.70 % |
| Rank in the world as per population | 2 |
| Population density | 464 per kilometer square |
| Total land area | 2,973,190 Km2 (1,147,955 sq. miles) |
| Population living in urban area | 35.0 % of the population is urban |
| Median Age | 28 |
Year-wise Population of India From 1947 to 2023
Based on the censuses of India and various sources on the Internet, we have compiled a list of year-wise population of India from 1947 to 2023.
- Population of India in 1947: 340 million
- 1951 – 382,376,948
- 1952 – 388,799,073
- 1953 – 395,544,369
- 1954 – 402,578,596
- 1955 – 409,880,595
- 1956 – 417,442,811
- 1957 – 425,270,695
- 1958 – 433,380,978
- 1959 – 441,798,578
- 1960 – 450,547,679
- 1961 – 459,642,165
- 1962 – 469,077,190
- 1963 – 478,825,608
- 1964 – 488,848,135
- 1965 – 499,123,324
- 1966 – 509,631,500
- 1967 – 520,400,576
- 1968 – 531,513,824
- 1969 – 543,084,336
- 1970 – 555,189,792
- 1971 – 567,868,018
- 1972 – 581,087,256
- 1973 – 594,770,134
- 1974 – 608,802,600
- 1975 – 623,102,897
- 1976 – 637,630,087
- 1977 – 652,408,776
- 1978 – 667,499,806
- 1979 – 682,995,354
- 1980 – 698,952,844
- 1981 – 715,384,993
- 1982 – 732,239,504
- 1983 – 749,428,958
- 1984 – 766,833,410
- 1985 – 784,360,008
- 1986 – 801,975,244
- 1987 – 819,682,102
- 1988 – 837,468,930
- 1989 – 855,334,678
- 1990 – 873,277,798
- 1991 – 891,273,209
- 1992 – 909,307,016
- 1993 – 927,403,860
- 1994 – 945,601,831
- 1995 – 963,922,588
- 1996 – 982,365,243
- 1997 – 1,000,900,030
- 1998 – 1,019,483,581
- 1999 – 1,038,058,156
- 2000 – 1,056,575,549
- 2001 – 1,075,000,085
- 2002 – 1,093,317,189
- 2003 – 1,111,523,144
- 2004 – 1,129,623,456
- 2005 – 1,147,609,927
- 2006 – 1,165,486,291
- 2007 – 1,183,209,472
- 2008 – 1,200,669,765
- 2009 – 1,217,726,215
- 2010 – 1,234,281,170
- 2011 – 1,250,287,943
- 2012 – 1,265,780,247
- 2013 – 1,280,842,125
- 2014 – 1,295,600,772
- 2015 – 1,310,152,403
- 2016 – 1,324,517,249
- 2017 – 1,338,676,785
- 2018 – 1,352,642,280
- 2019 – 1,366,417,754
- 2020 – 1,380,004,385
- 2021 – 1,393,409,038
- 2022 – 1,413,162,618
- 2023- 1,380,004,385
Population Growth rate of India from 1947 to 2023
The explosive growth in the population remains a constant challenge for the Indian governments after Independence. Numerous awareness campaign was launched by the government to make people aware of the benefits of small families.
Now, in recent years, these campaigns seem to work because the population growth rate is slowing down. You can check the year-wise population growth of India from 1947 to 2023.
- 1951 – 1.61%
- 1955 – 1.72%
- 1960 – 1.91%
- 1965 – 2.07%
- 1970 – 2.15%
- 1975 – 2.33%
- 1980 – 2.32%
- 1985 – 2.33%
- 1990 – 2.17%
- 1995 – 1.99%
- 2000 – 1.85%
- 2005 – 1.67%
- 2010 – 1.47%
- 2015 – 1.20%
- 2016 – 1.10%
- 2017 – 1.07%
- 2018 – 1.04%
- 2019 – 1.02%
- 2020 – 0.99%
- 2021 – 0.97%
- 2022 – 0.95%
- 2023- 0.99%
Most Populous Cities in India 2023
As stated earlier, the population of India has drastically increased. At the same, the urban population also increased. Due to this reason, there are many cities that have become overcrowded. Let’s take a look at the top 70 most populated cities in India in 2023.
- Mumbai
- Delhi
- Bengaluru
- Kolkata
- Chennai
- Ahmedabad
- Hyderabad
- Pune
- Surat
- Kanpur
- Jaipur
- Navi Mumbai
- Lucknow
- Nagpur
- Indore
- Patna
- Bhopal
- Ludhiana
- Tirunelveli
- Agra
- Vadodara
- Gorakhpur
- Nashik
- Pimpri
- Kalyan
- Thane
- Meerut
- Nowrangapur
- Faridabad
- Ghaziabad
- Dombivli
- Rajkot
- Varanasi
- Amritsar
- Allahabad
- Visakhapatnam
- Teni
- Jabalpur
- Haora
- Aurangabad
- Shivaji Nagar
- Solapur
- Srinagar
- Chandigarh
- Coimbatore
- Jodhpur
- Madurai
- Guwahati
- Gwalior
- Vijayawada
- Mysore
- Ranchi
- Hubli
- Jalandhar
- Thiruvananthapuram
- Salem
- Tiruchirappalli
- Kota
- Bhubaneshwar
- Aligarh
- Bareilly
- Moradabad
- Bhiwandi
- Raipur
- Gorakhpur
- Bhilai
- Jamshedpur
- Borivli
- Cochin
- Amravati
Also Check: Top Populated Cities in the World
Demographics of India
India is a country with multiple cultures and diverse religions. Given below is the religious demographic data of India as per the census of 2011.
Population of different religion in India
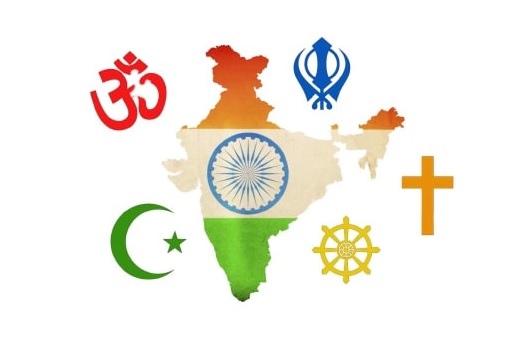
- Hindus – 966,378,868 – 79.80%
- Muslims – 172,245,158 – 14.23%
- Christians – 27,819,588 – 2.30%
- Sikhs – 20,833,116 – 1.72%
- Buddhists – 8,442,972 – 0.70%
- Jains – 4,451,753 – 0.37%
- Others – 7,937,734 – 0.66%
- Not Stated – 2,867,303 – 0.24%
Languages of India by number of native speakers
- Hindi – 422,048,642 – 41.030%
- Bengali – 83,369,769 – 8.110%
- Telugu – 74,002,856 – 7.190%
- Marathi – 71,936,894 – 6.990%
- Tamil – 60,793,814 – 5.910%
- Urdu – 51,536,111 – 5.010%
- Gujarati – 46,091,617 – 4.480%
- Kannada – 37,924,011 – 3.690%
- Malayalam – 33,066,392 – 3.210%
- Odia – 33,017,446 – 3.210%
- Punjabi – 29,102,477 – 2.830%
- Assamese – 13,168,484 – 1.280%
- Maithili – 12,179,122 – 1.180%
- Bhili/Bhilodi – 9,582,957 – 0.930%
- Santali – 6,469,600 – 0.630%
- Kashmiri – 5,527,698 – 0.540%
- Nepali – 2,871,749 – 0.280%
- Gondi – 2,713,790 – 0.260%
- Sindhi – 2,535,485 – 0.250%
- Konkani – 2,489,015 – 0.240%
- Dogri – 2,282,589 – 0.220%
- Khandeshi – 2,075,258 – 0.200%
- Kurukh – 1,751,489 – 0.170%
- Tulu – 1,722,768 – 0.170%
- Meitei (Manipuri) – 1,466,705 – 0.140%
- Bodo – 1,350,478 – 0.130%
- Khasi – Garo – 1,128,575 – 0.112%
- Mundari – 1,061,352 – 0.105%
- Ho – 1,042,724 – 0.103%
- Tripuri – 1,011,294 – 0.103%
Frequently Asked Question
The most populous state in India is Uttar Pradesh.
According to the National Family Health Survey 2019-21 (NFHS-5) India’s Sex ratio is 1020 females per 1000 males.
Kerala has the highest sex ratio with 1084 females per 1000 males.
According to National Statistical Office (NSO) data (2021), India’s literacy rate is around 77.70%.
The most spoken language in India is Hindi with more than 41% speakers.
Related Toppics:
 General Awareness Questions and Answers
 Medieval Indian History Gk Questions – Medieval Indian History Quiz
 Longest, Largest, and Biggest in India and the World
 National Science Day 2024: Theme, Date, History, Celebration
 IPL 2021, 2022 & 2023 GK Questions & Answers: GK Quiz on Indian Premier League (IPL)
 List of All Presidents of the Bharatiya Janata Party (1980-2023)
 Miss USA List (1952-2023)
 Finance Minister of India 1947 – 2023: Check Names, and Tenures and All Ministers of Finance Since Independence
 GK Quiz Questions on Rivers of World 2023
 How many minutes are in a day? Know Some Mind-Blowing Facts about Time and its Calculation